Titanic
Using Titanic’s passengers’
post-accident statistics, I determined the likelihood of
survival categorised by gender, age, class and marital status.
For this project I have used Kaggle. The dataset can be found on this page
Data Preview
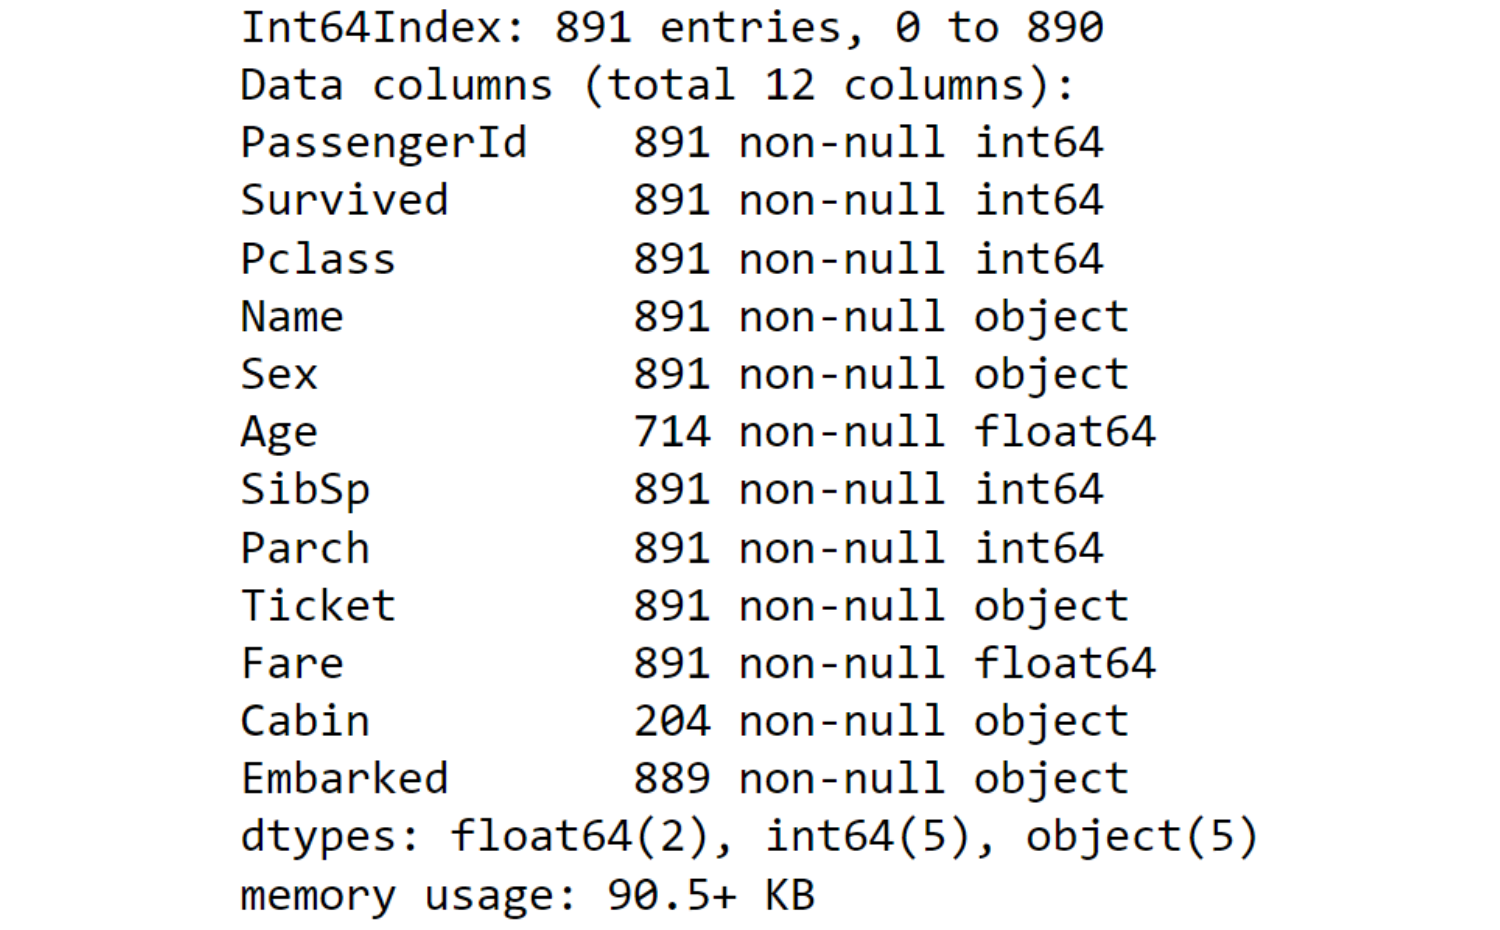
Observations
- The dataset contains 891 rows
- The dataset contains 12 columns
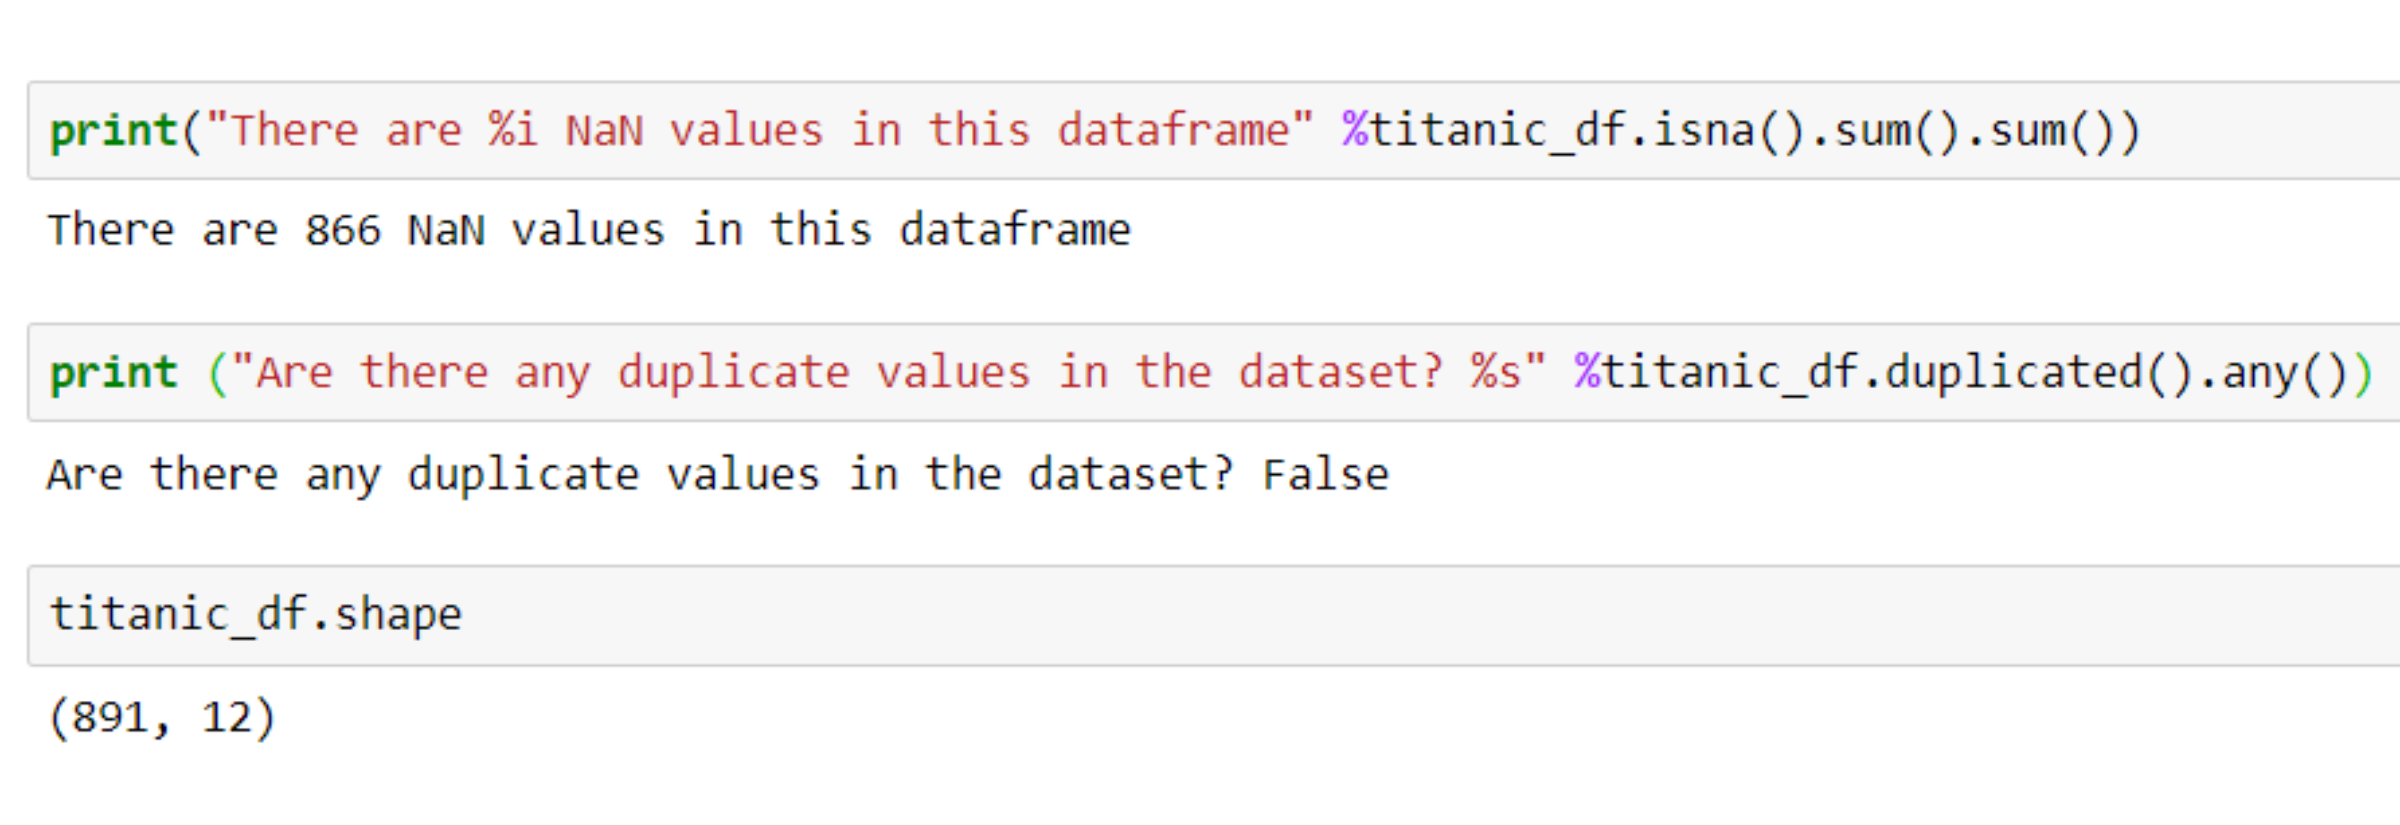
- There are 866 NaN values (most of them are in the Cabin column, but also in Age and 2 Embarked)
- There are no duplicate values
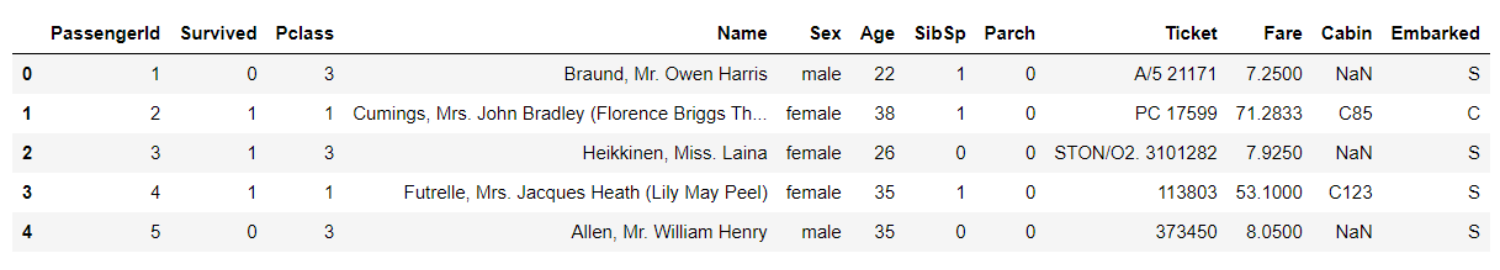
Data Dictionary
| Variable | Definition | Key |
|---|---|---|
| PassengerId | Id of the passenger | |
| Survived | Survival | 0 = No, 1 = Yes |
| Pclass | Ticket class | 1 = 1st Class, 2 = 2nd Class, 3 = 3th Class |
| Name | Name of the passenger | |
| Sex | Sex of the passenger | |
| Age | Age in years | |
| SibSp | Number of siblings / spouses aboard the Titanic | |
| Parch | Number of parents / children aboard the Titanic | |
| Ticket | Ticket number | |
| Fare | Passenger fare | |
| Cabin | Cabin number | |
| Embarked | Port of embarkation | C = Cherbourg, Q = Queenstown, S = Southampton |
Passengers categorisation
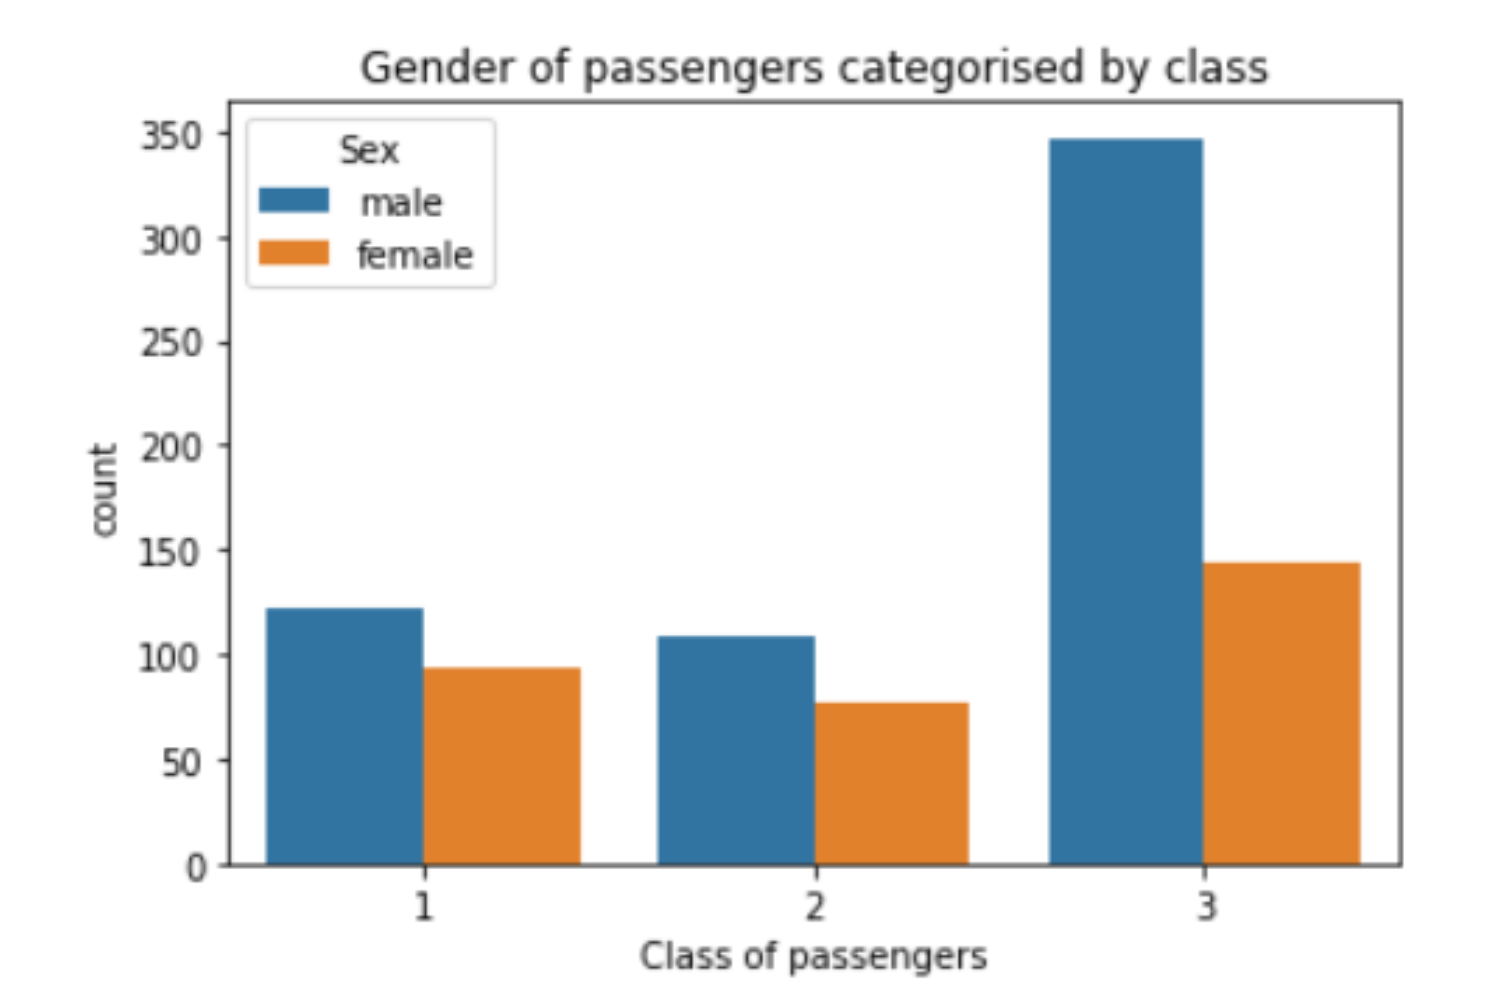
 I could also divide the passengers by sex for each class.
Observations
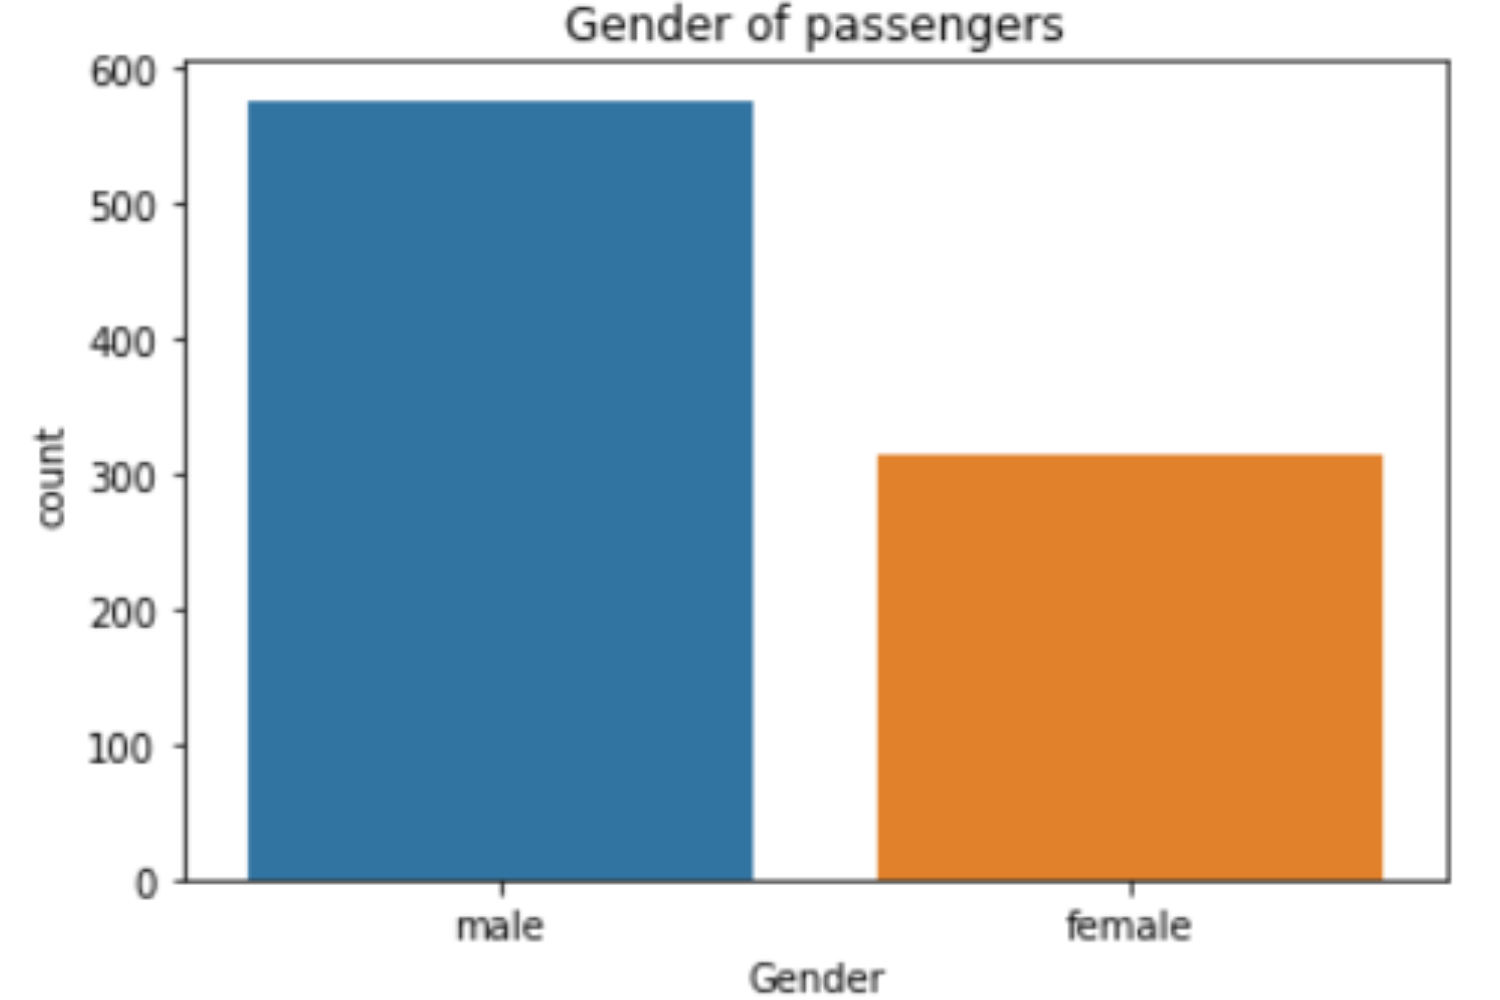
- The total number of males was nearly double compared to that of female passengers.
- If the dataset is categorised by the class in which the passengers were, the first and second classes had an equal distribution of males and females.
- The third class presented a majority of males instead.
Age classification
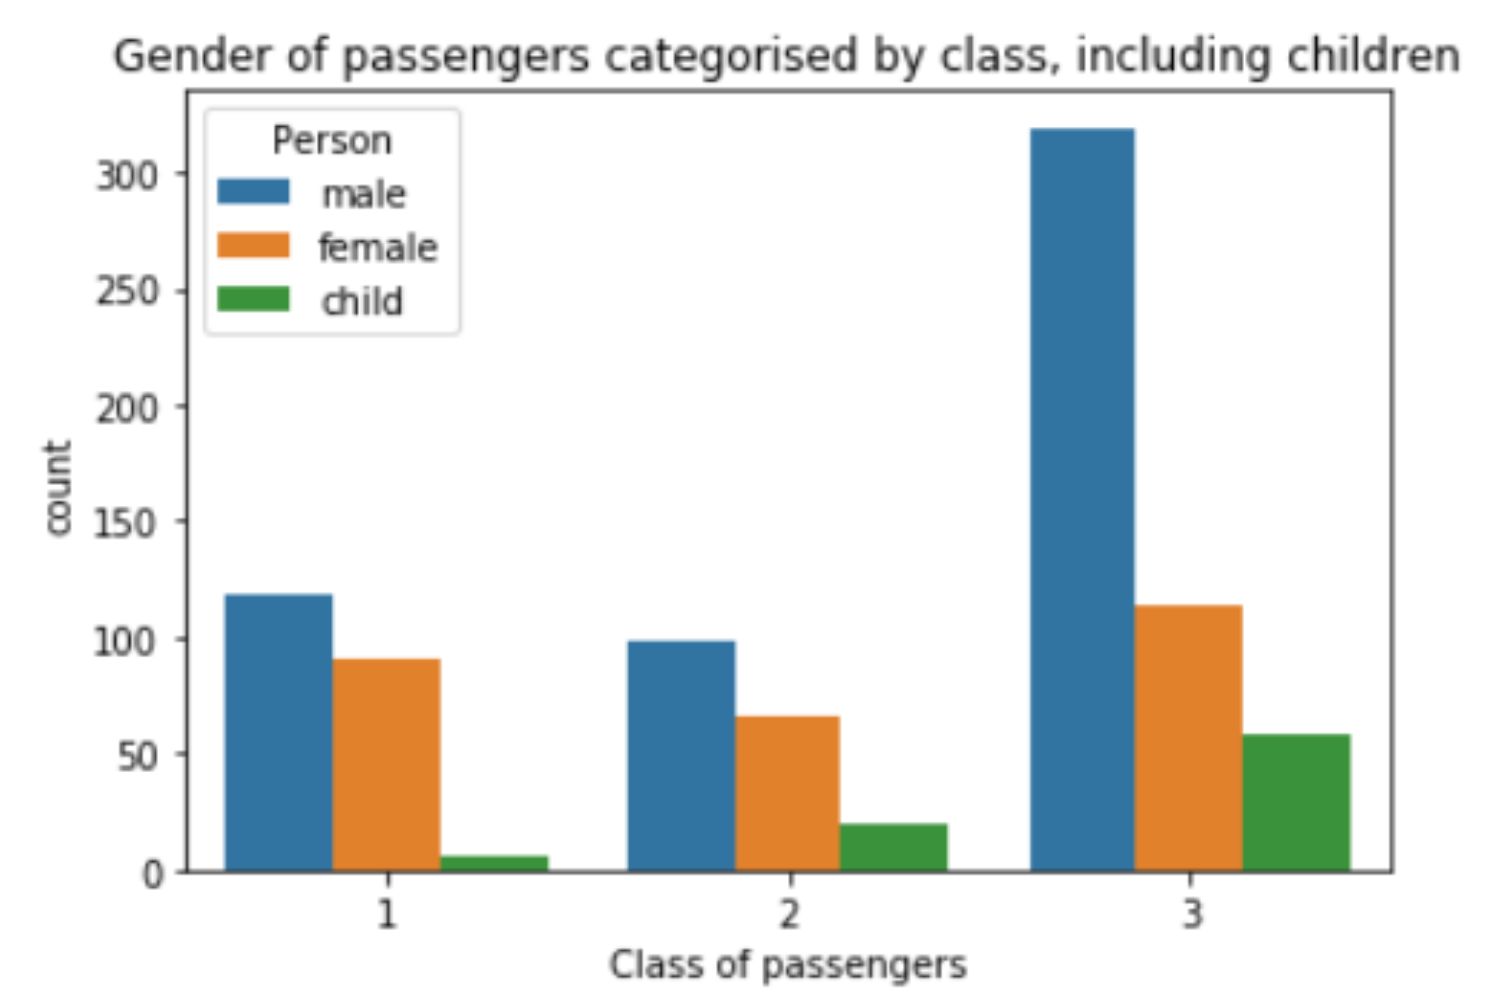
Based on the Age dataset I was able to further differentiate the population by visualising the number of under 16 passengers to the bar chart. To do this I extrapolated all passengers that were under 16 (males and females) and categorised them as "child".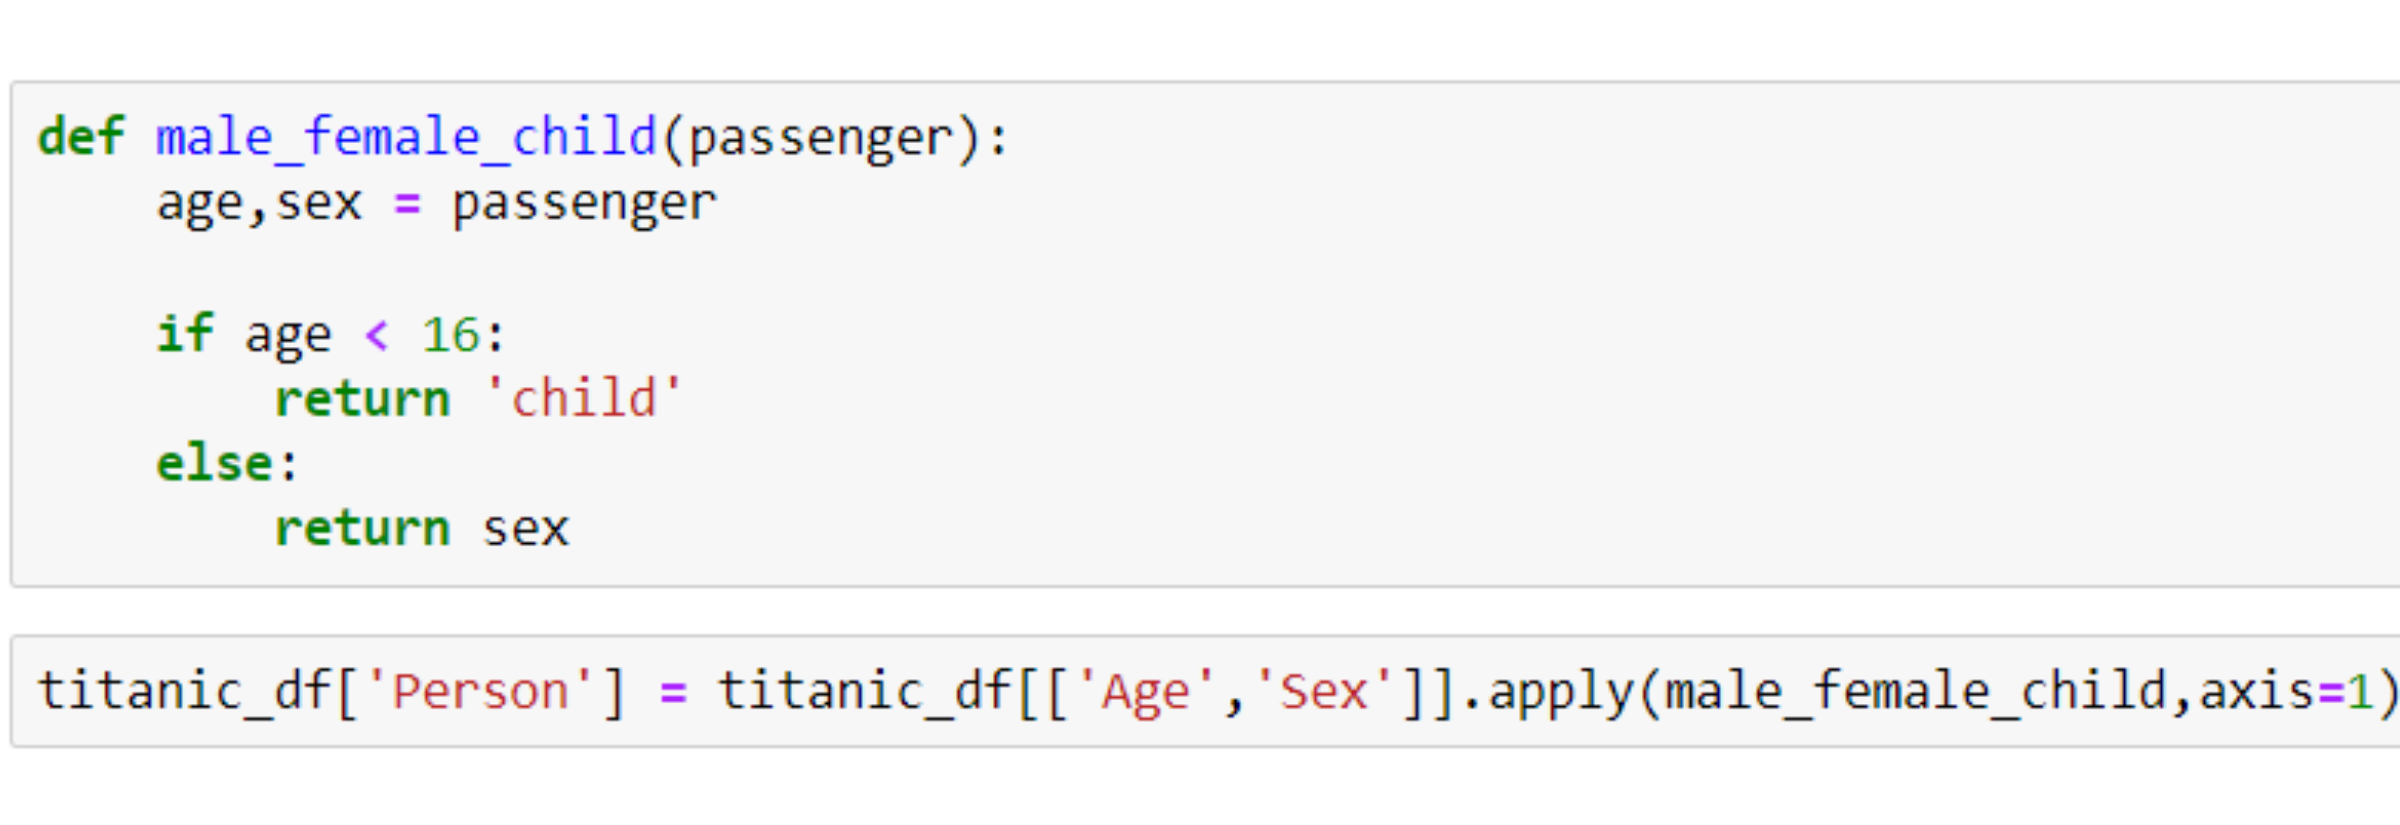
Observations
- Most of the children were in the third class
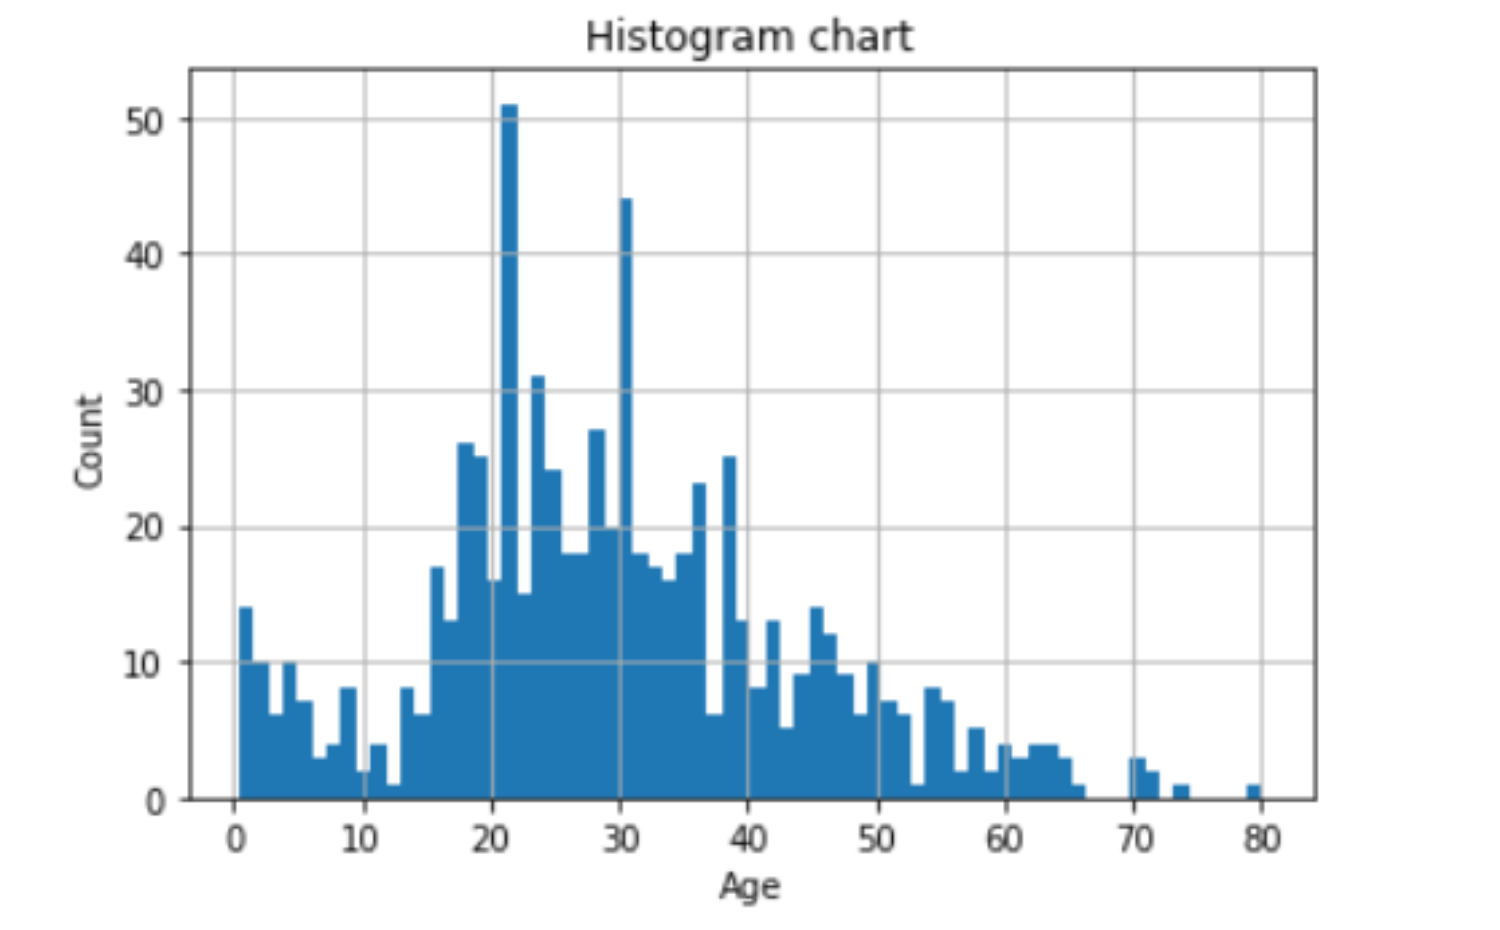
Age Histogram chart
kdeplot by age
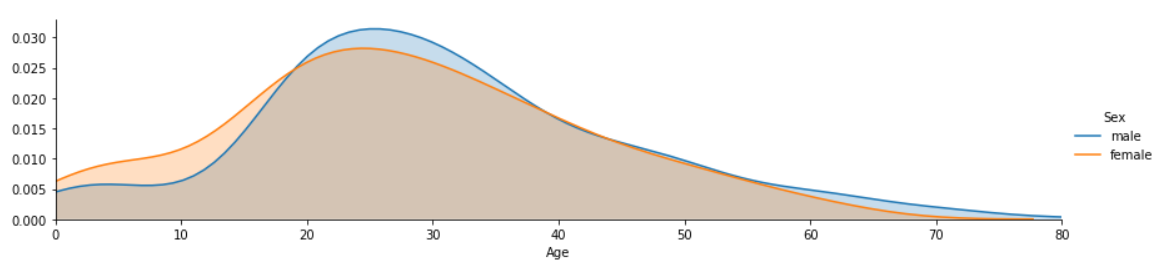
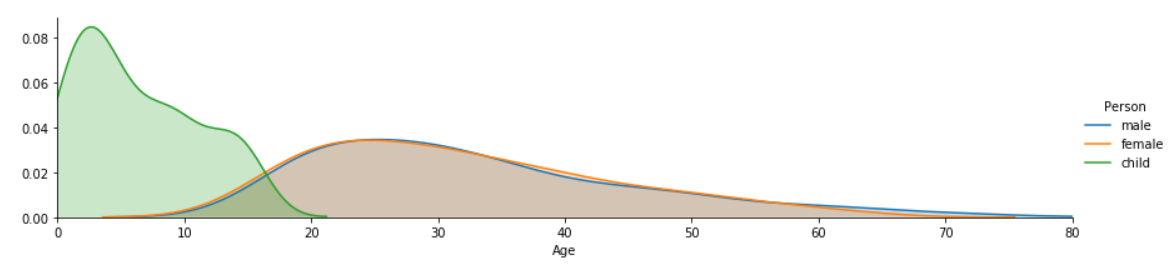
Observations
- Most of the passengers were between 20 and 30 years old
- Most of the children were between 0 and 5 years old
Family classification
Thanks to the SibSp ("Number of siblings/spouses aboard the Titanic") and Parch ("Number of parents/children aboard the Titanic") data, I was able to determine who was travelling alone or not.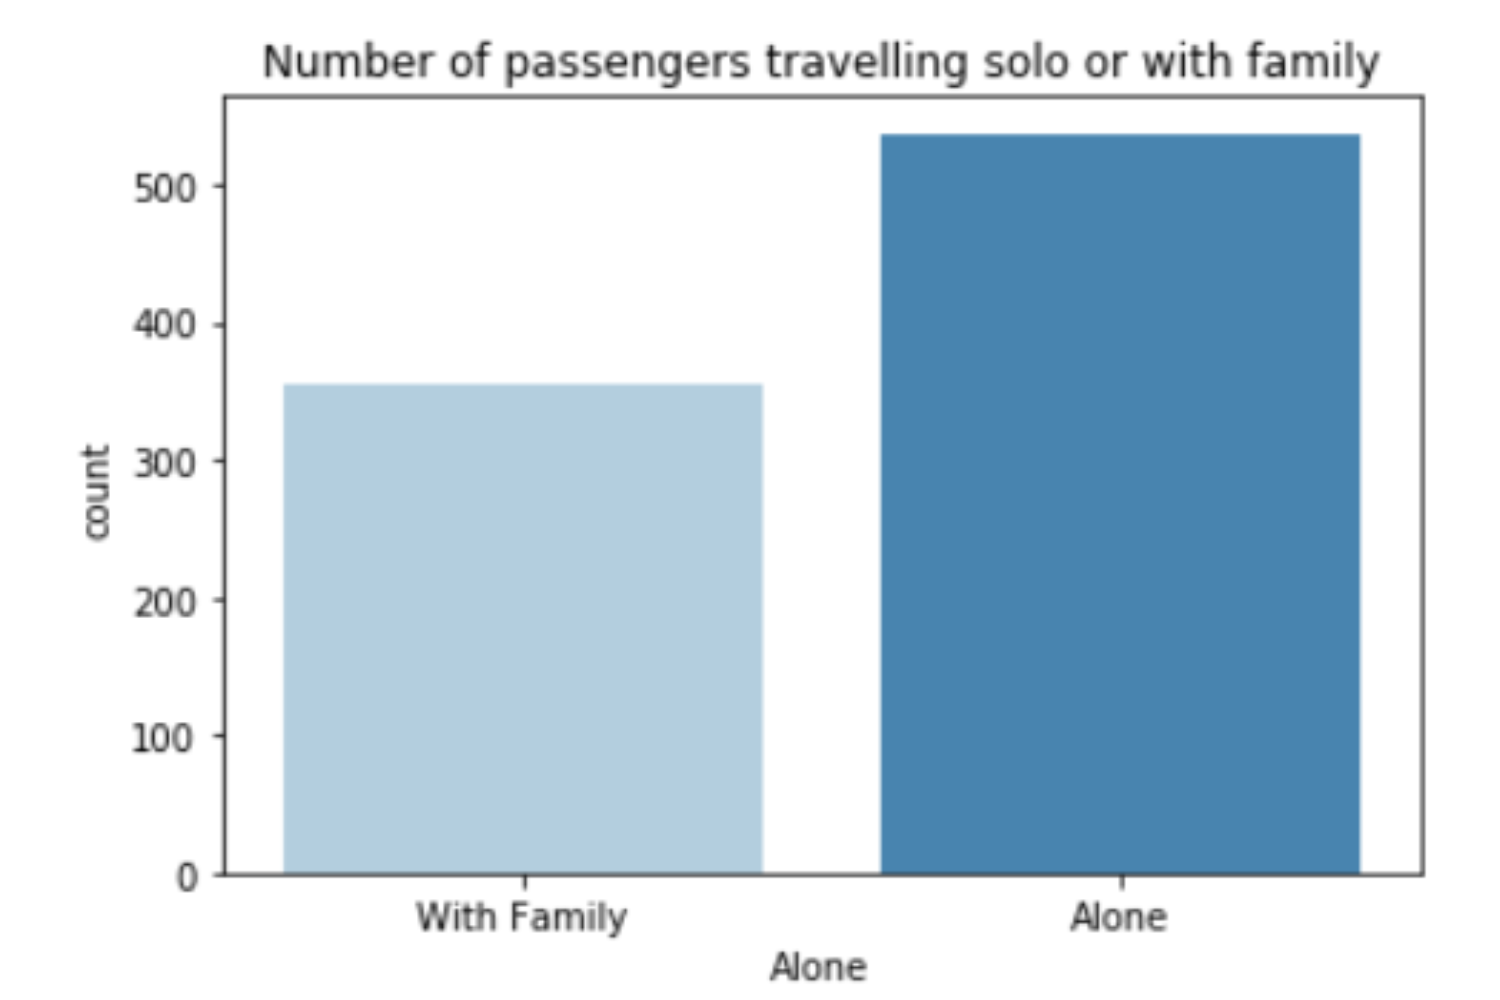
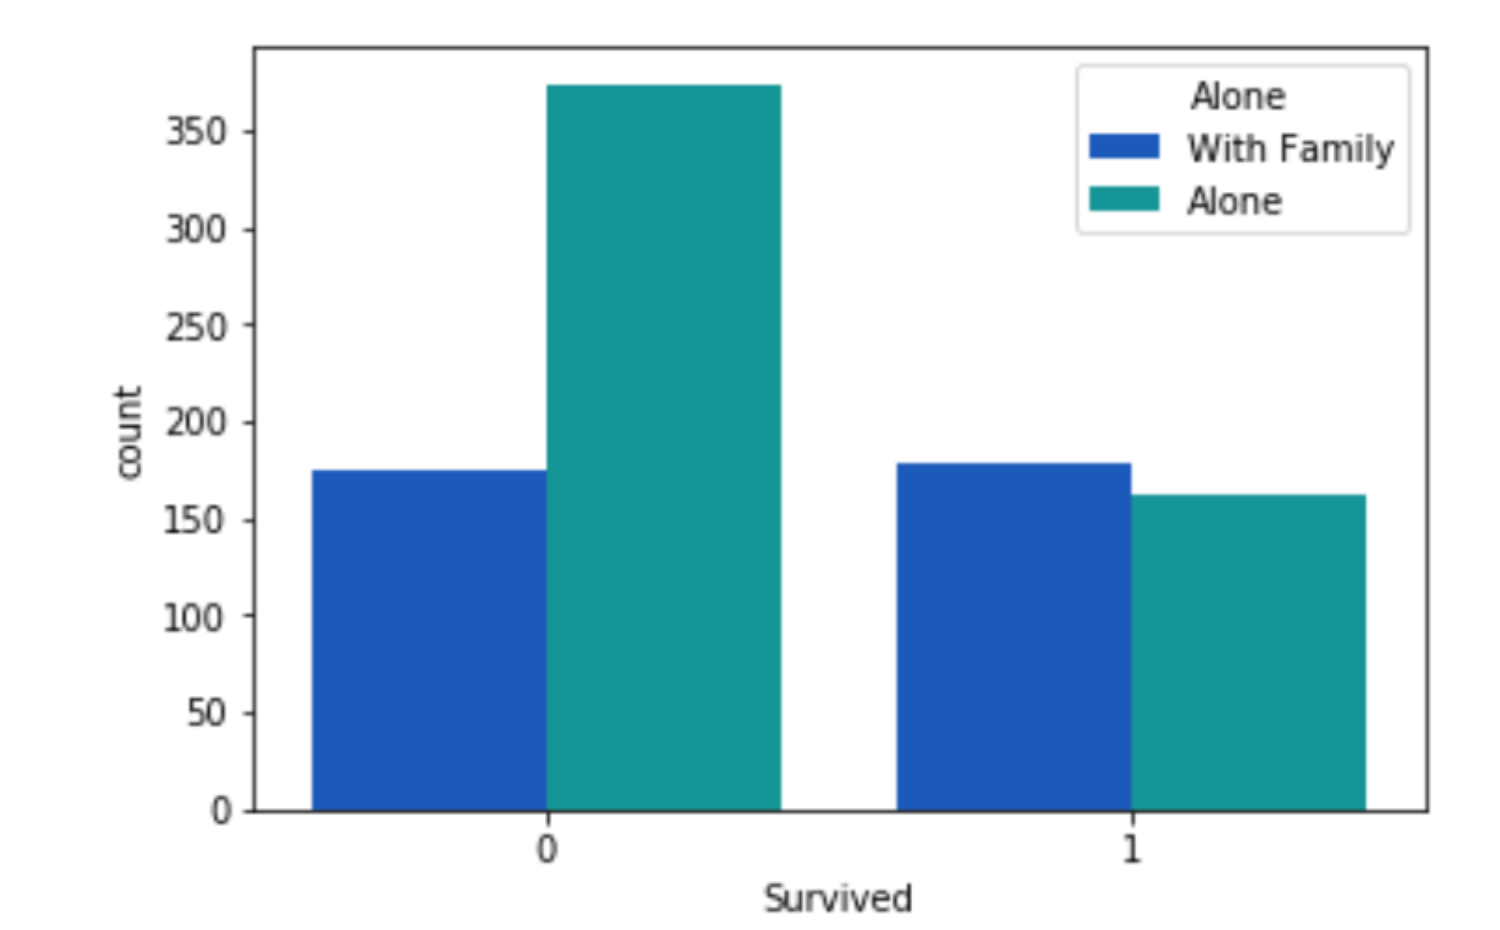
Observations
- Most of the passenger were travelling alone
- Survival rate was significantly lower for the passengers who were travelling alone (0 = they didn't survive, 1 = they survived)
Survival rate
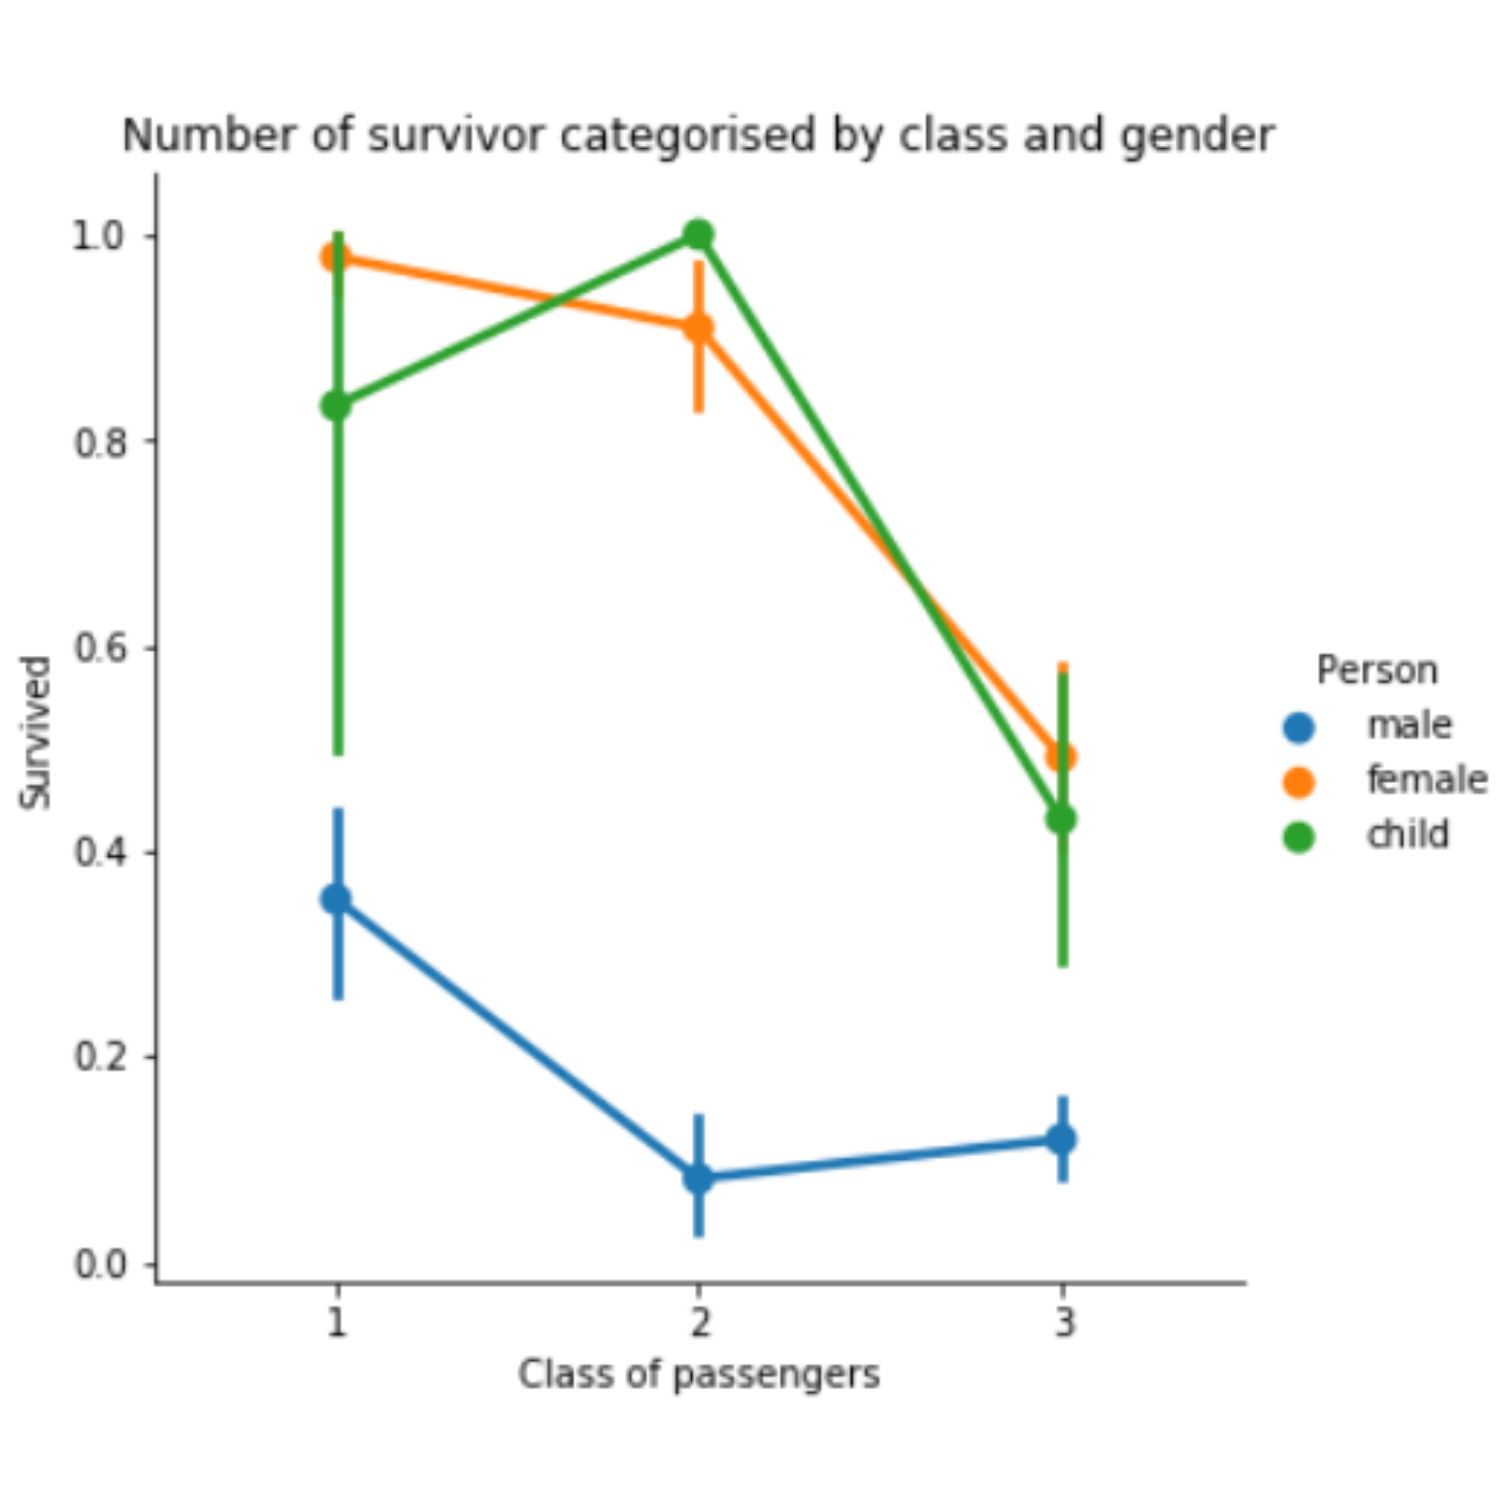
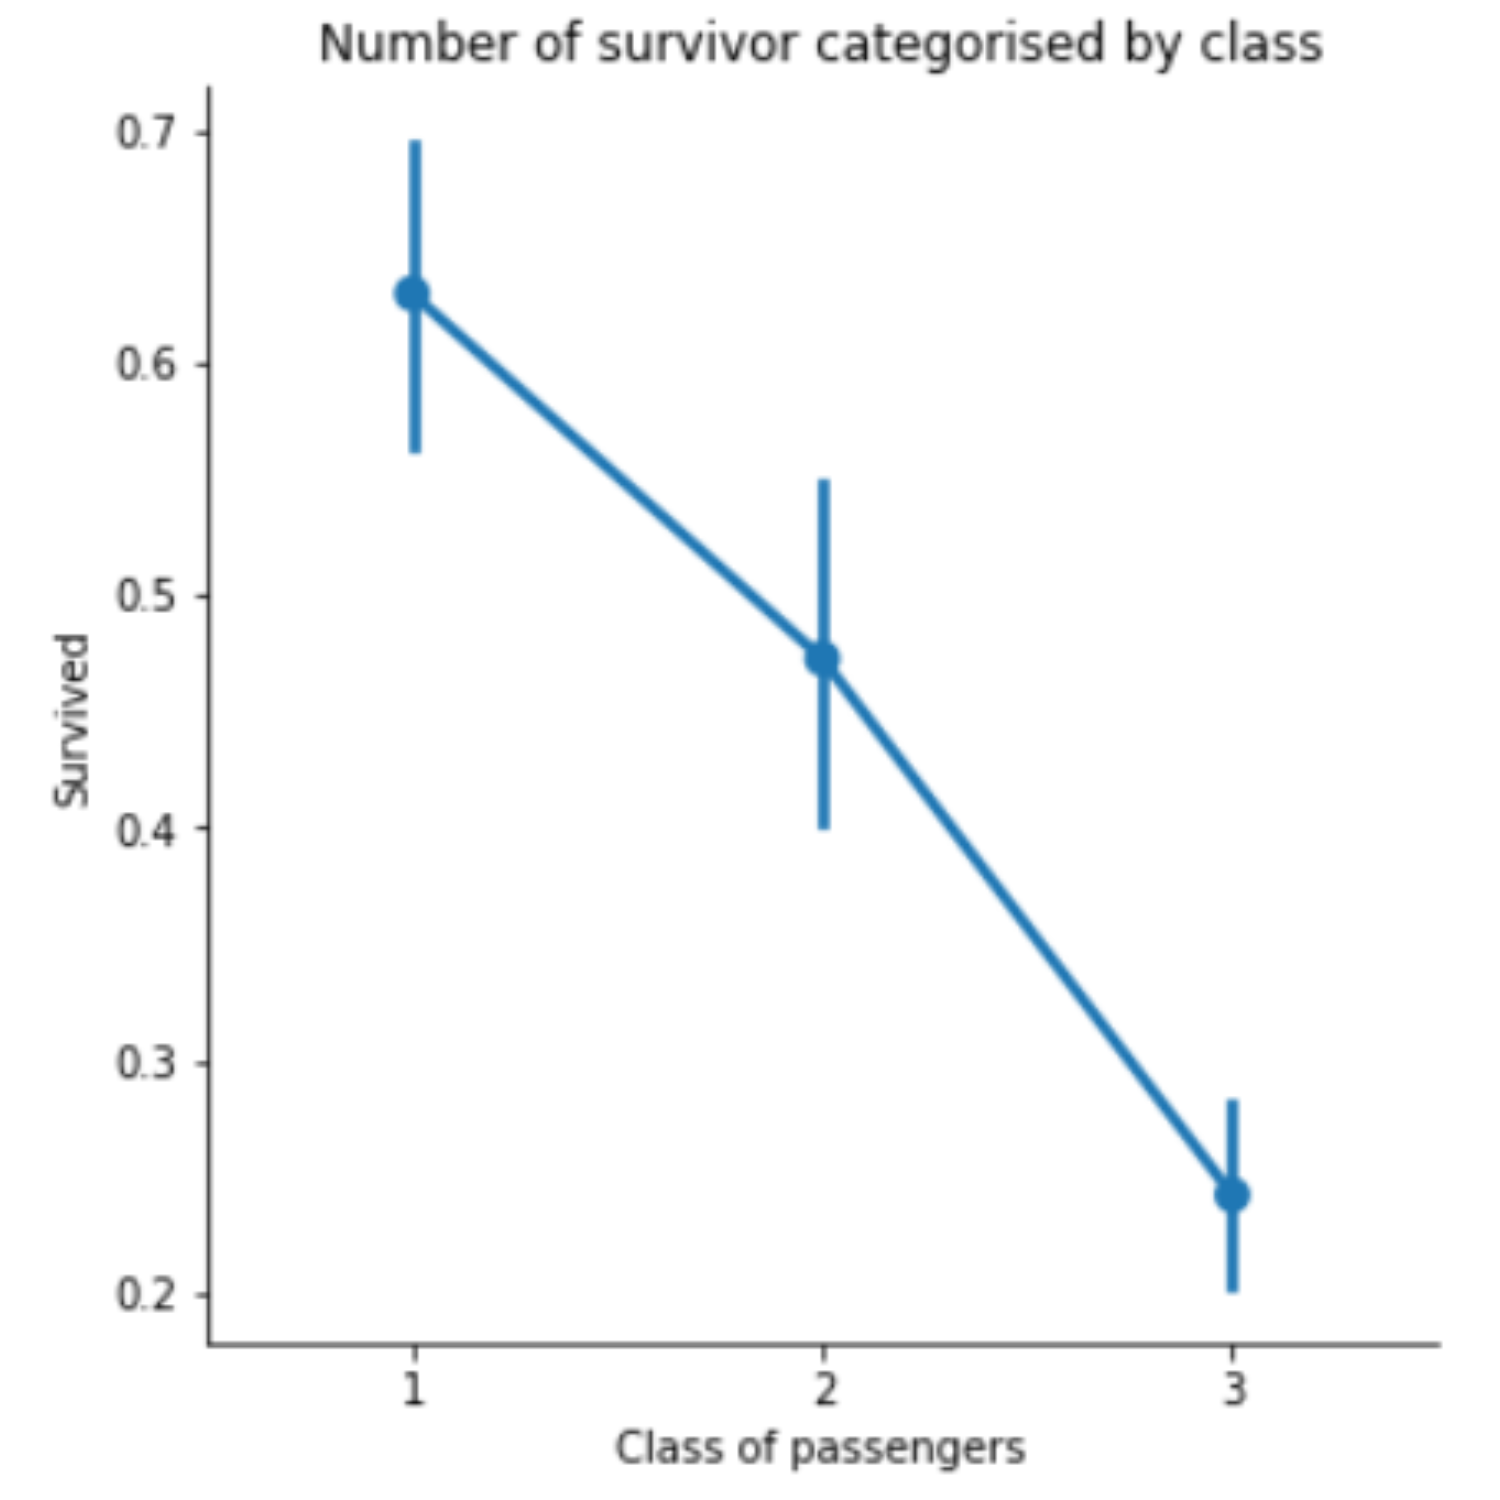
Observations
- Males had a significantly lower survival rate
- Passengers in the first and the second class had a higher survival rate